Tuesday, January 11, 2011

Buy low sell high principal - Swing trading methods


If anyone is going to adopt the swing trading methods he or she must understand the very basic principle of it that is "Buy Low and Sell High". This is very simple yet it is ignored by many novice traders especially those who like to scalp the market.

Low and High happens in any market patterns whether it is uptrend, downtrend, or sideways. This is because the market move in stages, its not like one time shoot and reach certain target at once. In uptrend for example after reaching certain resistant level (usually mark by previous movement) it will make correction or retracement to put the market movement in its normal average point. So the market will move down for a while before moving further up to reach the new resistant level. So in order not to get caught in the correction movement try not buy at the new high, but after the correction.

Likewise in downtrend the market will retrace after reaching certain support level before making continuation further downwards. In order not to get caught in the correction, try not to be sell further when the market reaching a new low

On the sideways trend it is very obvious, the market will fluctuate within identical support resistant area. So in this case buy low and sell high principle is much easier to notice compare to uptrend and downtrend. In this case simply Buy Low and Sell High.

This is a great and simple principle of swing trading.

Plan For forex trading

Here is some idea where you can start your trading day with a confidence decision.
Daily Trade Planning
  1. Look into the big picture – Monthly & Weekly time frames
  2. Look into detail – 5 minutes to daily time frames
  3. Check support/resistance level – Bollinger Bands & Price History
  4. Check fundamental factors (Economic Calendar) – To avoid unnecessary volatile movement that defies the technical analysis i.e. non-farm payrolls, interest rates, CPI, etc.
  5. Dividing 24 hours time into 6 sections using the 4 hourly charts – Avoid rollover fees and make sure one day trade must end in one day.
  6. Be patience – setup at the right position
  7. Use little of your instinct and confidence based on the technical indicators situation
  8. Decide your trade.

Forex Chart Patterns

Trading with the chart patterns can be easy if you know how to distinguish them and how to place the entry and exit orders correctly. There are many different chart patterns recognized by the expert financial traders. But in my opinion, in Forex trading there are five most important and rather frequently appearing patterns: ascending, descending and symmetrical triangles and rising and falling wedges. Here you will find the models of these patterns and their descriptions:

Ascending Triangle
Generally, it’s a bullish continuation pattern but the breakout in each direction is possible. If you like taking risk you can go long immediately after you spot this pattern. But if you want to be careful it’s recommended to wait until breakout appears in either side. The most important parts of the ascending triangle are the horizontal line and the upwardly sloping line. It’s also important for the price rate to touch each of those lines at least twice before breakout. This rule is vital for all of the 5 Forex chart patterns presented in this article. As you can see on the image, the price has touched the sloping line three times and the horizontal line two times and then broke out through the latter. Stop-loss should be placed slightly below the horizontal line. As the moderate pull-back is possible, consider placing stop loss near 70% level on the way from the sloping line to the horizontal one in place of the breakout. Take-profit should be placed according to the auxiliary sloping line, which runs from triangle’s top-left angle parallel to the main sloping line. Consider placing your target at the auxiliary line’s level in place of the breakout.

Ascending Triangle

Descending Triangle
Generally, it’s a bearish continuation pattern but the breakout in each direction is possible. As with the previous pattern you can go short immediately after you spot it. Wait for breakout in either side to enter a high-probability position. The most important parts of the descending triangle are the horizontal line and the downwardly sloping line. The price rate should touch each of those lines at least twice before breakout. As the image shows, the price has touched the sloping line three times and the horizontal line two times and then broke out down. Stop-loss and take-profit levels are placed using the same principles as with the ascending triangle.

Descending Triangle

Symmetrical Triangle
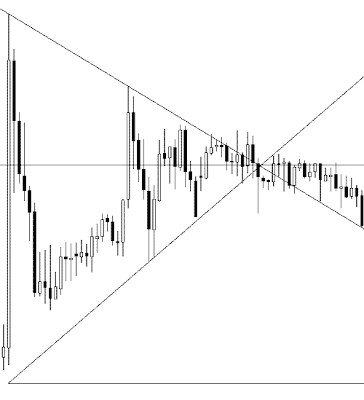
Generally, it’s a continuation pattern that breaks out in the direction of the previous trend, but in practice breakout in every direction is possible. As always, you may decide to open a position in the direction of the previous trend immediately as you spot this triangle. If you wait for breakout then you have better chances of success. The most important parts of the symmetrical triangle are the downwardly and upwardly sloping lines and the horizontal line that bisects the angle created by the first two lines. The last line should be really horizontal (several degrees of error are allowable) or otherwise it’s some kind of a wedge but not a symmetrical triangle. As always, the price should touch each of the main sloping lines at least twice before breakout. Symmetrical triangle, which is shown on the image, breaks out downwardly after touching the bottom line three times and the top line multiple times. Stop-loss should be placed near 70% level on the way from the opposite sloping line to the horizontal line in the basement of the triangle (not the breakout point like before). Take-profit can be set near the auxiliary horizontal line, which runs from the top or bottom base angle (depends on the breakout direction) of the triangle and is parallel to the main horizontal line.

Symmetrical Triangle

Rising Wedge
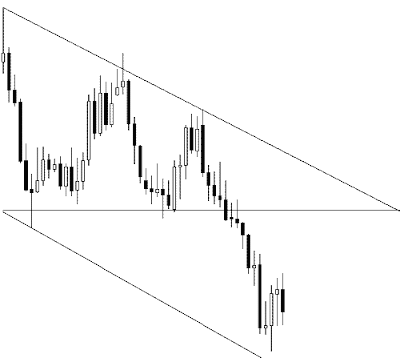
Usually, this chart pattern signals a reversal from the previous trend, but both upward and downward breakouts are possible. You can enter a risky trade immediately when you see this pattern. Wait for a clear breakout to enter a more probable trade. The crucial parts of the rising wedge are the two upwardly sloped lines that form a wedge. The price should touch each of them at least twice before breakout. On the image below you can see that the price touched top line two times and the bottom line multiple times. The downward breakout is shown. Stop-loss can be set at the auxiliary line that bisects the angle of wedge; set it near the level of the auxiliary line at the breakout. Take-profit is set near the auxiliary line (not shown on the image) that runs from the top or bottom base angle (depending on the breakout direction) of the wedge and is parallel to the opposite sloping line. E.g. in the picture’s example wedge the line should start at the bottom angle of the wedge and be parallel to the top sloping line. Take-profit should be placed near the level of that auxiliary line at breakout.

Rising Wedge

Falling Wedge
As its rising cousin, this chart pattern often signals a reversal from the previous trend, but both upward and downward breakouts are still possible. To enter a risky trade, open it immediately as you see this chart pattern. Wait for a clear breakout to enter a more probable trade. The main parts of the falling wedge are two downwardly sloped lines that form a wedge. The price should touch each of them at least twice before breakout. On the image you can see that the price touched the bottom line two times and the top line multiple times. Upward breakout is shown. Stop-loss and take-profit levels are set using the same principles as with the rising wedge.

Falling Wedge

Point-and-Figure Charting Explained

Friday, September 25, 2009
Point-and-figure charts (P&F) is another way to represent the price charts that can be used in Forex trading. Conventional charts display the price as the linear function of time, which results in a demonstrative picture of how the market behaved during certain periods of time. But the problem is that the trader often doesn’t need to know how price depended on time, all he needs is to know what the prevailing force on the market is at the moment — bulls or bears, demand or supply. That’s where P&F charts come handy. They show the price changes graphically, independently on the time during which the changes have occurred.

For example, the simple point-and-figure chart could look like this:


The green X’s are the price increases (by some certain value) and the red O’s are the price decreases. A column of X’s represent an uptrend, while the column of O’s represents a downtrend. In each given column there can be only X’s or O’s. When one trend ends a new column starts. As you see, there is no time scale in this chart. Each column can last an indefinite period of time.

So, how are these point-and-figure charts drawn? To start drawing a point-and-figure chart you should first set two important parameter values of the chart — the box size and the reversal distance.

The box size is the height of each of the O’s and X’s in pips. For example, if you set a box size to 10 pips, each X will mean an upward movement by 10 pips, so a column of 6 X’s is an upward movement by 60 pips. The same would be correct for the O’s.

The reversal distance is the amount of boxes that should be passed by a price in a reverse direction for a trend to reverse (to start a new column). The most common reversal distance is 3. That means that on a rising trend (a column of X’s) a price has to go down by the amount of pips in three boxes for a new column (this time — of O’s) to start. For example, if you use a box size of 10 and a reversal distance of 3: the price goes up by 60 pips, you draw 6 X’s, then the prices goes down by 30 pips (that’s more than 3 × 10), you draw 3 O’s down starting a new column from the level below the last X. If the price would go down by less than 30 pips you wouldn’t have to draw anything new. Basically, after drawing an X or O you just wait for the price to continue going in the direction for a box size of pips or in a reverse direction for a reversal distance * box size of pips.

If we consider 10 pips box size and reversal distance of 3 for the image above then we can say that first the price goes up by 50 pips during the first uptrend, then it goes down by about 50 pips, then goes an uptrend for 70 pips, then go two equal bearish and bullish trends for 30 pips (exactly the reversal distance). Then a price declines by 50 pips, then goes up by 30 pips and finally falls by 40 pips. It ends at +10 pips (if you sum up all the values) and, as you see on the picture, the ceiling of the final O is 10 pips above the bottom of the first X. That’s exactly +10 pips. The «effective price» is located at the bottoms of the X’s and at the tops of the O’s.

Using the point-and-figure charts is simple. Almost all chart patterns and analysis techniques that work with the classic time-based charts work with the point-and-figure charts too. The trends are very easy to visualize in the P&F charts because the square dimensions of the boxes (X’s and O’s) form nice 45-degree angle trendlines. Look at the example:


Apart from the chart pattern analysis, P&F charts offer a sort of trading signals. When the trend direction changes, a new position can be opened in this new direction with a stop-loss equal to the reversal distance. But such trading technique requires some thorough optimization of the box size and the reversal distance for the given currency pair and the market conditions.

If you have any questions or comments regarding point-and-figure charting, feel free to reply in the commentaries to this post.

Keep a Trading Journal


You have all read that it was imperative to keep a diary of trading in order to remember its operations and thus improve.However very few books you have proposed a plan, approach and a practical way to keep this journal. What should it contain? what form it takes?

Where to keep a trading Journal?
The first problem in keeping a trading journal is crass equipment.Where to keep?in what form?

You've probably all tried successively calendar paper, notebooks, file Word, Excel or Access the basis for those who know.However, these tools have their limits still on the agenda paper it is difficult to search, the Word file can not filter the information, the Excel file can filter (to isolate lose trades for example) but is not suitable for the insertion of copies of screens when the base access, it is operational after having planned and will be a rigid framework (changing its structure takes more time than adding a column in an Excel file after the table because it must touch screens and all states).inally, if you use multiple machines (home, work, laptop in the garden) modifying the file must be transferred to each of them (unless you use the file only from a USB key).

A solution exists: the private blog
The blog is not something that only serves to expose its trades in the eyes of all. It can be used for private and personal journal very comprehensive and effective (this is his first goal).He has all the advantages because you can write as much text as you want, insert images (chart), creating categories (win, loss, ideas, system, todo, ...), show that the notes belonging to a category where published between such and such date, search, etc ... And all this being totally independent of the machine where you work, more file to be transported from one PC to another.

For my part I use the new version of Blogger (http://beta.blogger.com, beta version of the new Google Blog - http://www.blogger.com), it represents a word happening on the blog, you are the only one who can access it.Their system is simple, efficient and very fast access, perfectly suited to the arrest of a Trading Journal.

More than a trading journal, I made my "Trading Desktop", I put all my ideas as they come, the results of statistical or backtest systems, the most promising and those not carrying anything.I also met my "todo list", all these things suggest that permanently postponed and some of my discoveries forward (soft, suppliers of datas, ...).
So my centralized repository of trading and 100% private.

To find myself using the categories that I stated in the "Labels" (Blogger in the bottom of the editing posts), for example:
- Win (trade winner)
- Loss (losing trade)
- Idea (idea)
- System (description of a trading system)
- Backtest (backtest results)
- Studies (results of a study)
- Indicators (technical)

When you see your newspaper, a simple click on the "win" will display all posts with this label, so you can easily filter the blog on your winning trades, your latest ideas, etc ... without having to sort all content.You will only see posts in category "win" or "idea".
Returning now trading on the newspaper itself.

What should contain a Trading Journal
It must not be overloaded, when we start, there is a tendency to always put more information than necessary.The hour of trade to the nearest second example is often not matter, we realize after 50 operations that never use this information in our reading of the newspaper (except that the hour of trade is at the heart of the system of course).To be effective, a Trading Journal must go to the bottom line is a means to assess its mistakes but also systems with which one is most effective and those on the contrary we are losing consistently.

Important factors are:
- The description of trade
- The setup: the conditions that led to trade
- The result: P & L in pips and $
- Performance Scoring
- Execution Scoring
- Feedback Summary
- Chart: screenshot

The description of trade must be simple and short, for example (hypothetical case):

Short GBPJPY @ 222.30, TP1 @ 222.00, TP2 @ 221.80, SL @ 222.50, SL @ Breakeven if TP1 Hit Short GBPJPY@222.30, TP1@222.00, TP2@221.80, SL@222.50, SL @ Breakeven if TP1 Hit

The setup may be the name of one of your systems:

Setup: MM Pullbacks / 15 min
Or a description of conditions:
Setup: Hit MM20 + Down Trend / 15 min
The result can be expressed in pips, in dollars or both and in case of multiple contain details:

P & L: +30 pips (Exit 1 @ TP1, Exit 2 @ Breakeven)

The scoring performance is one of the most important, it is inspired by John Carter proposals:

1. Target Hit Hit Target

2. profitable Output at a price different from Target but beneficial

3. Breakeven

4. Output at a different price but losing the Stop

5. Stop Hit

When you make your stock of the week, month, quarter and year, your resume and complete a scoring average.You can then separate them by setup to identify the most successful setups. If the setup MM Pullbacks displays at the end of the month an average of 3.87 while the setup Volatility Breakout 15min displays 1.82, which must be removed from my Trading plan? It is precisely to respond effectively to such Trading question that the Journal is so important.

The Execution Scoring is equally important, it lets you know if you have met your strategy.

1.Trade executed according to plan

2.Target Entry executed according to plan but before leaving Target

3.Entry executed according to plan but stop and removed or distant target

4.Late entry (quite in the terms of setup) and / or non-positioned Target (output target)

5.Unrestrained trade (no real setup in place at the time of trade, the worst case)

In the same way you can regularly average your scores to see if you meet your plans. Both the Performance Scoring depends on the quality of your systems and market uncertainties, all your Execution Scoring is up to you and you alone. He tells you if you are a trader impulsive or to a trader who Fixed a plan and follow to the letter. As you already know your goal is obviously to strive 1.

Finally I recommend you also see every weekend your trades and their performance in an Excel spreadsheet to help you build a scoreboard encrypted (P & L Gross, P & L / Setup, scoring middle period, ...).But unlike the trading will log you in this Excel spreadsheet or comment or details of trade, or chart.Do a weekly review of your trades and publish it on your blog, you'll see your P & L of the week, your scoring and your comments on the positive, negative and what needs to be improved for the following week.All this can only help you become a better trader.

3 Most Important Forex Fundamental Indicators

There are many fundamental indicators available to the Forex traders today. If you count all of them only for the major currency pairs you’ll get more than a hundred distinct indicators — macroeconomic, monetary, economical, financial, weather-based, etc. For many traders it’s difficult to follow all of them, as it requires time and efforts in addition to the necessity to learn about the effect of all these fundamental indicators on various currency pairs. This article lists 3 most important (in my humble opinion) fundamental indicators that have the highest impact on the currency rates and are quite easy to follow as they are reported not so often.
  • GDP or Gross Domestic Product is the main indicator of the macroeconomic strength of the country. The growth of GDP signals a stronger economy and a more competitive currency because the global investors will have to buy this currency in order to invest in this country, and they will want to invest in it because its economy is growing. GDP reports are usually published quarterly but they have three states of revision (advance, preliminary and final) published with the monthly intervals. GDP strongly affects currency pairs both in short-term and long-term. You’ll have a trading opportunity during the time of the release, as the volatility spikes up, and you’ll be able to adapt your long-term positions to the new data after the release.
  • Interest Rates are set by the world’s central banks and are the main tools of the monetary regulation. Higher interest rates provide more value to the affected currency, while the lower interest rates decrease the value of the currency. Interest rates are usually revised every month or two during the special monetary policy meetings of the central banks. Interest rate decisions greatly depend on the growth of GDP and other macroeconomic indicators. Currency pairs react with the high volatility to the unexpected interest rate changes. It’s important to monitor the trends in the interest rates to forecast the long-term trends of the traded currencies.
  • Unemployment Rates are influential indicators both for currency traders and for the monetary authorities when they set the interest rates. Non-farm payrolls are considered to be the most important of the unemployment indicators in USA and they are released monthly. Major currencies usually react with the short-term tendencies to such releases. Weekly reports on jobless claims can also be considered but they aren’t as influential.

In many cases it’s enough to be up to date with these fundamental indicators to understand the possible market trends in Forex. But, of course, if you wish to get a more detailed picture you shouldn’t limit yourself only with these indicators, especially if you pose yourself as a pure fundamental currency trader.

Choosing a Forex Broker

Choosing a forex broker can be daunting task. They all seem to sound so good when you read their sales pages, but how do you know which ones are worth your money?

Initial Deposit

You should look for a forex broker that has a low initial deposit. It is not a matter of the amount you should start trading with, but if a broker wants many thousands just for you to open an account, it is questionable. The ideal initial deposit requirements should be $300 to $500 or less.

Regulation

The forex market is an unregulated market meaning there is no central exchange. However, forex brokers themselves are regulated. In the US they should be registered as a Futures Commission Merchant (FCM) with the Commodity Futures Trading Commission(CTFC) and a member of the National Futures Association(NFA). You can verify a broker’s status with the NFA on the NFA web site. If you do not find the broker you are interested in listed with the NFA, look for another broker that is listed and has a clean record.

Customer Service

Forex trading hours vary depending on what currencies you are most interested in trading. With that in mind, it is important to find a broker with 24 hour customer service. The forex markets can be wild at times. If you had a question about order execution or a closed order, you should be able to get your question answered no matter what time it is. A good test of a forex broker’s customer service ability is to contact the support desk and ask some questions by phone. Keep notes on how responsive they are to your questions and what attitude they have about answering them. Remember, you are trusting these people with your money. You need to feel absolutely comfortable that all your needs will be addressed.

Currency Pairs

Find a broker that offers the currency pairs that you are most interested in trading, or at least a good variety to choose from. Currency pairs tend to have different breathing patterns and you want to have a good menu of selections.

Software

A professional and easy to use trading platform is a must. You would not want to be struggling with the features of the trading platform while trying to make a trade. Any reputable forex broker will offer the ability to trade on a demo account. The demo software operates the same way as the live trading platform. This will give you a chance to fully test out the trading platform without the pressure of using real money.

Reputation

Always check the reputation of a forex broker. One way is to do a google search with the name of the broker plus the word “complaints”. Check around and get opinions from traders on forex message boards. Spend a fair amount of time doing your research. This is an important relationship. You will want to be absolutely comfortable with the broker that you decide on. The important thing to remember is that you will have to do some homework here. It is imperative that you are not lazy about it. Don’t be sucked in by a glossy sales page with extraordinary claims. Investigate! Use a demo account. Take some time to shop around. In the end, you will be happy that you did.